
Unlock real-time market insights with Benzinga’s Trending Tickers API. Learn how to track the most active stocks over short-term periods, analyze data trends, and make informed investment decisions by monitoring ticker activity, mention counts, and percentage changes in market sentiment.
by Thomas Cotter
October 2, 2024
Monitoring the trending tickers in the stock market can offer valuable insights into market sentiment and potential investment opportunities. By identifying stocks that are generating significant interest over specific timeframes, traders and investors can react to emerging trends and make informed decisions. In this how-to guide, we’ll explore Benzinga’s Trending Tickers API, which allows users to track the most active tickers over short-term periods such as 10 minutes, 1 hour, or 1 day.
In this guide, we will explore how to retrieve trending tickers using Benzinga’s API and perform further data analysis to gain insights. Additionally, we’ll try drawing useful insights from the endpoint’s output.
Benzinga’s Trending Tickers API
Benzinga’s Trending Tickers API is designed to provide real-time insights into the most discussed or traded tickers for a given timeframe. The data is aggregated from various retail trader-focused sources across the web, capturing the stocks generating significant attention among retail investors. This allows users to get a comprehensive view of which stocks are trending based on mentions, discussions, and trades driven by retail traders.
The API returns data on the ticker symbol, its associated exchange, the number of mentions (count), and the percentage change in the number of mentions compared to previous intervals. The available timeframes include:
10 minutes
1 hour
1 day
Additionally, the API allows querying specific tickers to gain insights into how they have trended over a given timeframe. The dataset can be invaluable for active traders and those looking to spot emerging market trends early.
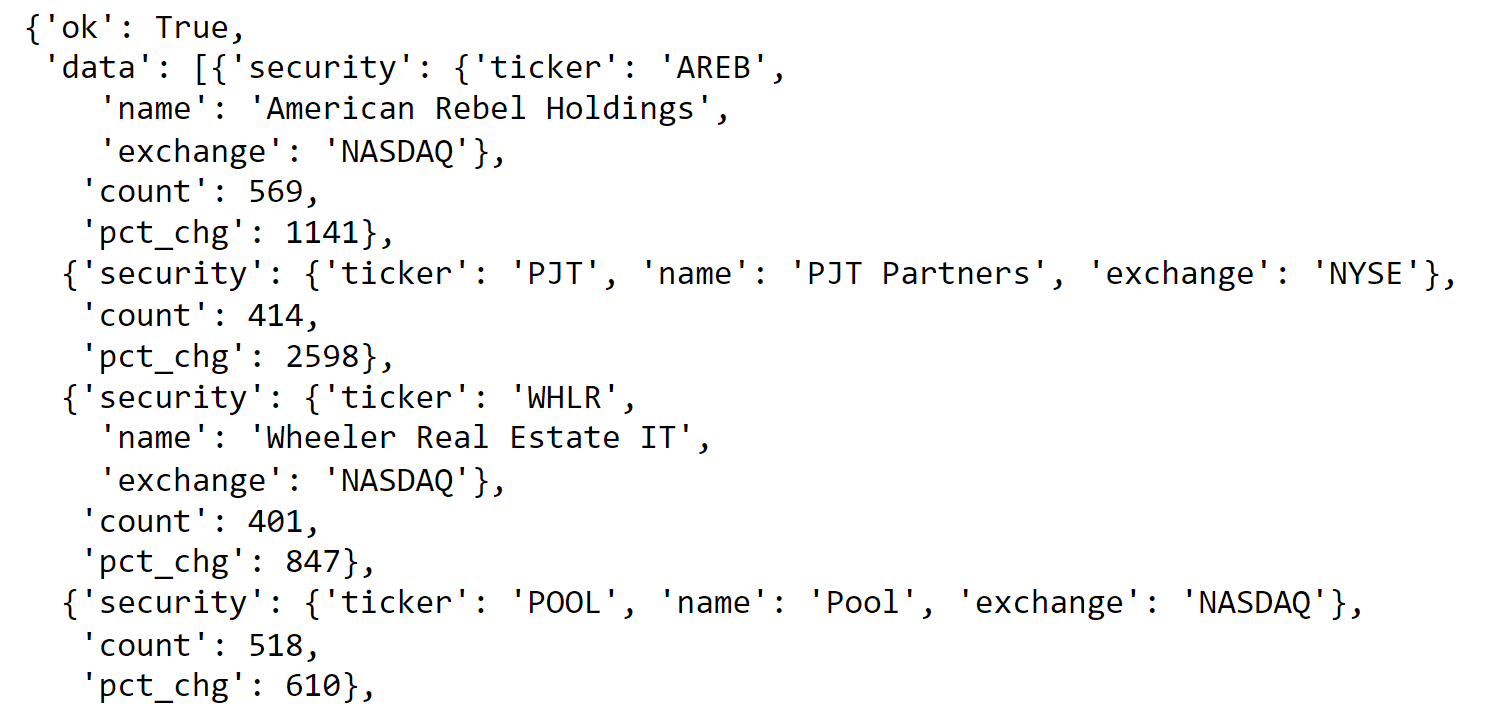
Here’s a sample of the API’s output for a given timeframe:
Importing Packages
Before diving into the extraction process, we first need to import the required packages, including requests to handle the API call, pandas to format the data, and matplotlib and seaborn to create visualizations.
These libraries provide the core functionality for fetching and analyzing the data. Pandas helps to structure the data in DataFrames, while Matplotlib and Seaborn offer powerful plotting tools to visualize the trends.
Extracting Trending Tickers Data
Now that we have imported the necessary packages, let’s extract trending tickers data using Benzinga’s Trending Tickers API. In this example, we’ll focus on retrieving trending tickers for the last 1-hour timeframe.
This code performs the following operations:
API call: The requests.get() function is used to call Benzinga’s Trending Tickers API with the appropriate API key and timeframe set to 1 hour. The API responds with a JSON structure containing data for trending tickers.
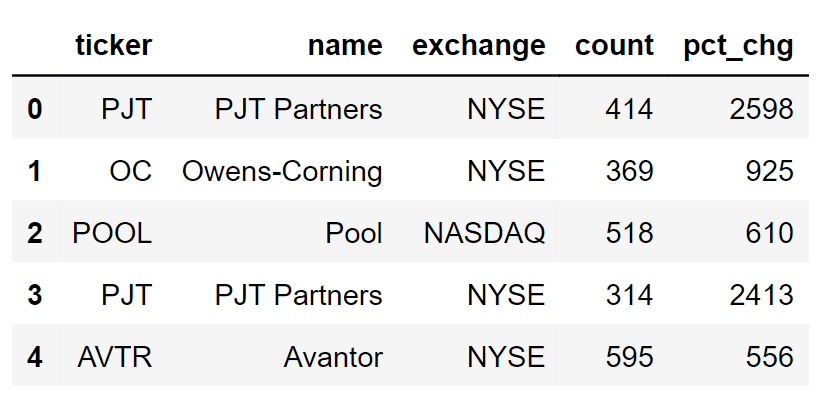
Data extraction: The JSON response is converted into a Pandas DataFrame for easier manipulation. The ‘security’ field, which contains the ticker, name, and exchange information, is normalized into separate columns using pd.json_normalize(). The count of mentions (count) and the percentage change (pct_chg) are also extracted and added to the DataFrame.
Here’s what the DataFrame looks like after extracting the data:
Further Analysis
With the trending tickers data successfully extracted, we can now perform further analysis to gain deeper insights into the behavior and performance of these stocks. In this section, we will conduct four types of analysis: visualizing the top 10 trending tickers, analyzing the percentage change in mentions, identifying consistently trending stocks across multiple timeframes, and examining which exchanges host the most trending stocks.
1. Visualizing the Top 10 Trending Tickers
To begin, we’ll take a closer look at the top 10 most mentioned tickers in the last hour. This allows us to identify the stocks generating the most interest and attention in the market.
This code normalizes the JSON response to extract relevant information, such as the ticker symbol and mention count. After identifying the top 10 tickers based on the number of mentions, a bar plot is generated to visually represent these stocks.
Output:
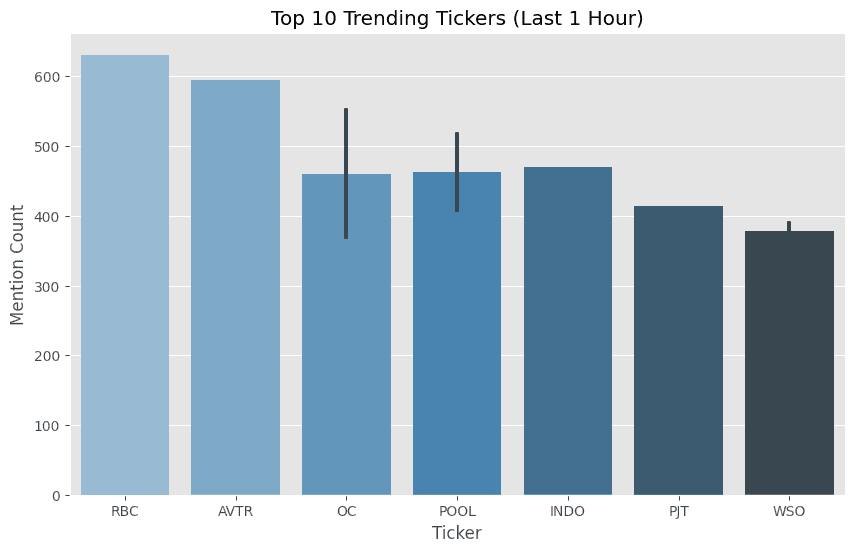
The stocks at the top of this chart are those that have garnered the highest number of mentions. These tickers are worth monitoring as they may indicate significant market interest or volatility, potentially signaling investment opportunities.
2. Plotting the Percentage Change in Mentions
Next, we will analyze the percentage change in mentions for the top 10 trending tickers. This metric can highlight stocks experiencing a sudden surge in attention, indicating a potential shift in market sentiment.
The percentage change in mentions (pct_chg) is plotted for the top 10 trending tickers. This chart helps us identify stocks that have seen the largest relative increases in the number of mentions over the specified timeframe.
Output:
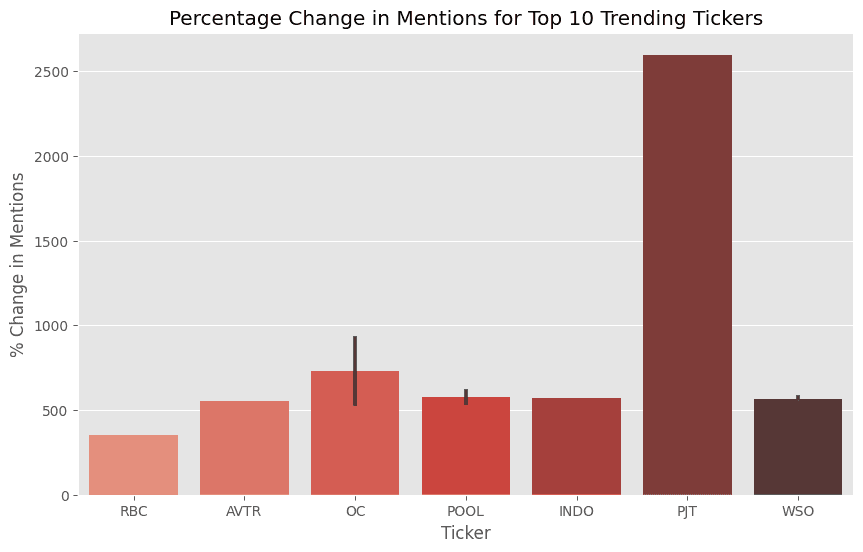
Stocks with a large percentage change may be experiencing rapid changes in sentiment or attention. This can be an early indicator of news events, trading activity, or other market catalysts driving the sudden increase in mentions.
3. Identifying Consistently Trending Stocks Across Timeframes
In this analysis, we’ll examine which stocks have remained consistently trending across different timeframes (10 minutes, 1 hour, and 1 day). This helps identify stocks that have sustained market interest over time.
This code extracts data for three different timeframes (10 minutes, 1 hour, and 1 day) and combines the results into a single DataFrame. It then identifies stocks that have trended across all three timeframes.
Output:
Stocks that remain consistently trending across multiple timeframes are likely to have sustained market interest. This could be due to significant events, news coverage, or a broader trend that persists over time, making them worth watching closely.
4. Identifying Exchanges with the Most Trending Stocks
Finally, we’ll examine which exchanges are hosting the most trending stocks. This analysis helps us understand which stock exchanges have the highest activity in terms of trending tickers.
# Extracting data for different timeframes (10 minutes, 1 hour, 1 day)


timeframes = ['10m', '1h', '1d']


dfs = {}


for timeframe in timeframes:


    url = f'https://api.benzinga.com/api/v1/trending-tickers/list?token={api_key}&timeframe={timeframe}'


    response = requests.get(url).json()


    # Extract ticker, exchange, and count information


    tickers = [entry['security']['ticker'] for entry in response['data']]


    exchanges = [entry['security']['exchange'] for entry in response['data']]


    df = pd.DataFrame({'ticker': tickers, 'exchange': exchanges})


    df['timeframe'] = timeframe


    dfs[timeframe] = df


# Combine all timeframes into a single DataFrame


df_combined = pd.concat(dfs.values())


# Counting the occurrences of trending stocks by exchange


exchange_trends = df_combined.groupby('exchange')['ticker'].count().reset_index(name='count_by_exchange')


# Visualizing the most active exchanges with trending stocks


sns.barplot(x = 'exchange', y = 'count_by_exchange', data = exchange_trends, palette = 'Greens_d')


plt.title('Trending Stocks by Exchange Across Timeframes')


plt.xlabel('Exchange')


plt.ylabel('Number of Trending Stocks')


plt.xticks(rotation = 45)


plt.show() |
In this analysis, we extract ticker and exchange information for different timeframes and aggregate it to count the number of trending stocks per exchange. This is then visualized in a bar plot.
Output:
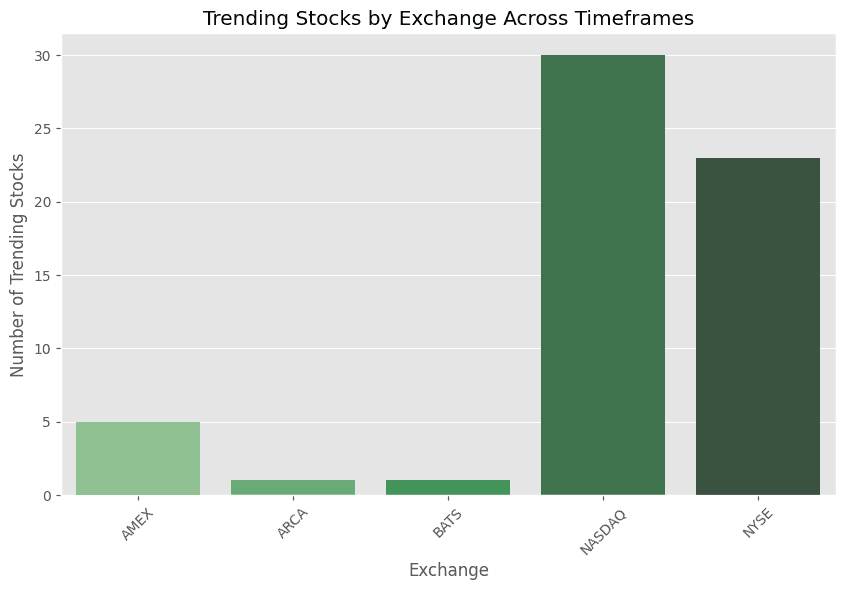
The chart provides insight into which exchanges are seeing the most trending stocks. Exchanges with higher counts may be experiencing greater activity or market interest, helping investors identify where the most significant trading opportunities might be.
Conclusion
In this guide, we learned how to leverage Benzinga’s Trending Tickers API to analyze stocks gaining attention within short timeframes. By visualizing top tickers, tracking percentage changes in mentions, identifying consistently trending stocks, and analyzing activity across exchanges, we gained actionable insights into market trends that can guide trading strategies.
The API’s flexibility allows for deeper, customized analyses, making it a valuable tool for spotting emerging opportunities and staying ahead of market shifts. With the right approach, traders can use this data to make more informed, data-driven investment decisions.


OTHER ARTICLES

Utilizing the Benzinga News Archive to Power your LLM
The Benzinga News S3 bucket houses an extraordinary source of comprehensive data with the potential to power any Large Language Model (LLM).

Client Spotlight: Yahoo! Finance’s Integration of the Benzinga Analyst Ratings API
Check out how Yahoo! Finance integrated the Benzinga Analyst Ratings API.

Predicting and Analyzing Markets Utilizing a News Archive
LLMs can play a crucial role in decision-making, offering insights into market directions, strategic choices, and an accurate portrayal of the market landscape.
Quick Contact
Address
1 Campus Martius Detroit,
MI 48226, United States
Phone
Get in Touch